


 Ana Castrillon
  2024")

Join us as we navigate through the landscape of consumer opinions, unveiling the nuances that define the relationship between individuals and artificial intelligence. From convenience to concerns, we explore the diverse spectrum of sentiments that consumers harbour, shedding light on the evolving role of AI and chatbots in our rapidly changing digital world.
Navigating the labyrinth of a bustling contact centre isn’t for the faint-hearted.
Every missed call, every disgruntled customer, and every minute shaved off average handling time could significantly impact customer satisfaction ratings. It’s here that contact centre metrics are vital.
In this article, you’ll find a curated selection of key metrics. We’re not just offering a rundown; these are precisely the metrics numerous contact centre leaders we work with rely on to evaluate call centre performance and gauge how agents are performing.
We’ll also go into the ‘why’ behind each metric, so that you can understand how each fits into the bigger picture of your customer experience.
Tailoring metrics to your contact centre’s objectives
First, let’s get one cardinal rule out of the way: Metrics are never one-size-fits-all.
Different centres have various KPIs that are aligned with their unique business goals. It’s also vital to recognise that within a contact centre, different internal teams often track distinct sets of metrics based on their roles and responsibilities.
For example, operational teams focus on efficiency and cost-effectiveness. For them, metrics like Average Handle Time and Service Level are closely watched. These metrics help gauge the overall productivity of the centre, revealing if agents are optimally utilised and whether the centre is meeting its service level agreements.
On the other hand, support teams, often focused on customer service, rely on a different set of indicators such as Customer Satisfaction (CSAT), and Customer Effort Score (CES). These metrics offer insights into customer sentiments and can gauge the quality of the service being provided.
By tailoring the metrics to the respective team’s objectives, Contact Centre managers can accurately measure how efficiently each team is performing, and whether the contact centre as a whole is operating to its full potential.
The Ripple Effect: How one metric can influence another
An often-overlooked factor when measuring contact centre metrics is what we call “the ripple effect.”
This effect can be observed when a change in one metric can have an impact across your entire customer service ecosystem, either elevating multiple KPIs or pulling them down in a cascading effect.
Let’s take the example of First Response Time (FRT). On the surface, it measures how quickly your agents engage with customers upon initial contact. Improve this metric, and the ripple effects become quickly apparent. Customers feel acknowledged, which can lead to better Customer Satisfaction Scores (CSAT). A faster FRT also means a quicker resolution time, which has a positive impact on your Average Handle Time (AHT).
But here’s where it gets truly interesting. If your team is consistently quick in first responses, it can reduce the volume of follow-up calls or escalation tickets, streamlining the workload and leading to a more focused, less stressed team. This, in turn, can affect the overall employee satisfaction and retention rates, indirectly contributing to better customer service.
Conversely, a decrease in FRT can set off a chain reaction of negative outcomes—lower CSAT scores, increased AHT, and higher levels of stress among your agents, leading to burnout and high turnover rates.
When a contact centre manager appreciates the metrics’ interconnectedness, they’re able to swiftly take action on the appropriate metric when needed in a more focused fashion, allowing them to allocate resources more effectively.
Let’s now explore the top contact centre metrics you should be monitoring.
Broadly, we like to categorise them as:
- Customer Experience Metrics
- Agent Performance Metrics
- Early Perception Metrics
- Operations Metrics
Customer Experience Metrics
Customer Satisfaction Score (CSAT)

This is the pulse of your customer’s happiness. The CSAT serves as an immediate, post-interaction snapshot capturing the emotional pulse of your customer base. Typically gauged through a straightforward question such as, “How satisfied are you with your experience?”, the CSAT is calculated using a scale, often from 1 to 5 or 1 to 7, where the higher numbers correspond to greater satisfaction.
Here’s how to calculate the CSAT:
- Collect the responses from your customers.
- Add up the number of positive responses (commonly those who answered 4 or 5 on a 5-point scale, or 6 to 7 on a 7-point scale).
- Divide this sum by the total number of responses collected.
- Multiply the result by 100.
Why is CSAT important:
The score represents the percentage of customers who are satisfied with your service. For example, if you get a CSAT score of 80%, it means that 80% of your customers are satisfied with the service they received.
The magic of CSAT lies in its immediacy and specificity. It enables contact centre managers to quickly identify both successful interactions and areas requiring attention. Tracking CSAT in real-time can be a powerful diagnostic tool; it can flag potential issues before they escalate, thus averting the loss of customer trust.
Customer Effort Score (CES)
The CES is a crucial metric expressed as a number between 0–100 that quantifies the simplicity—or complexity—of your customer interactions. Utilising CES surveys, the key question often posed is,
“To what extent do you agree with the following statement: The company made it easy for me to handle my issue.”
Typically, customers respond using a scale that ranges from 1 to 7, indicating their level of agreement or disagreement with the given statement. In this scale, ‘1’ could signify “Strongly Disagree” and ‘7’ could stand for “Strongly Agree.”
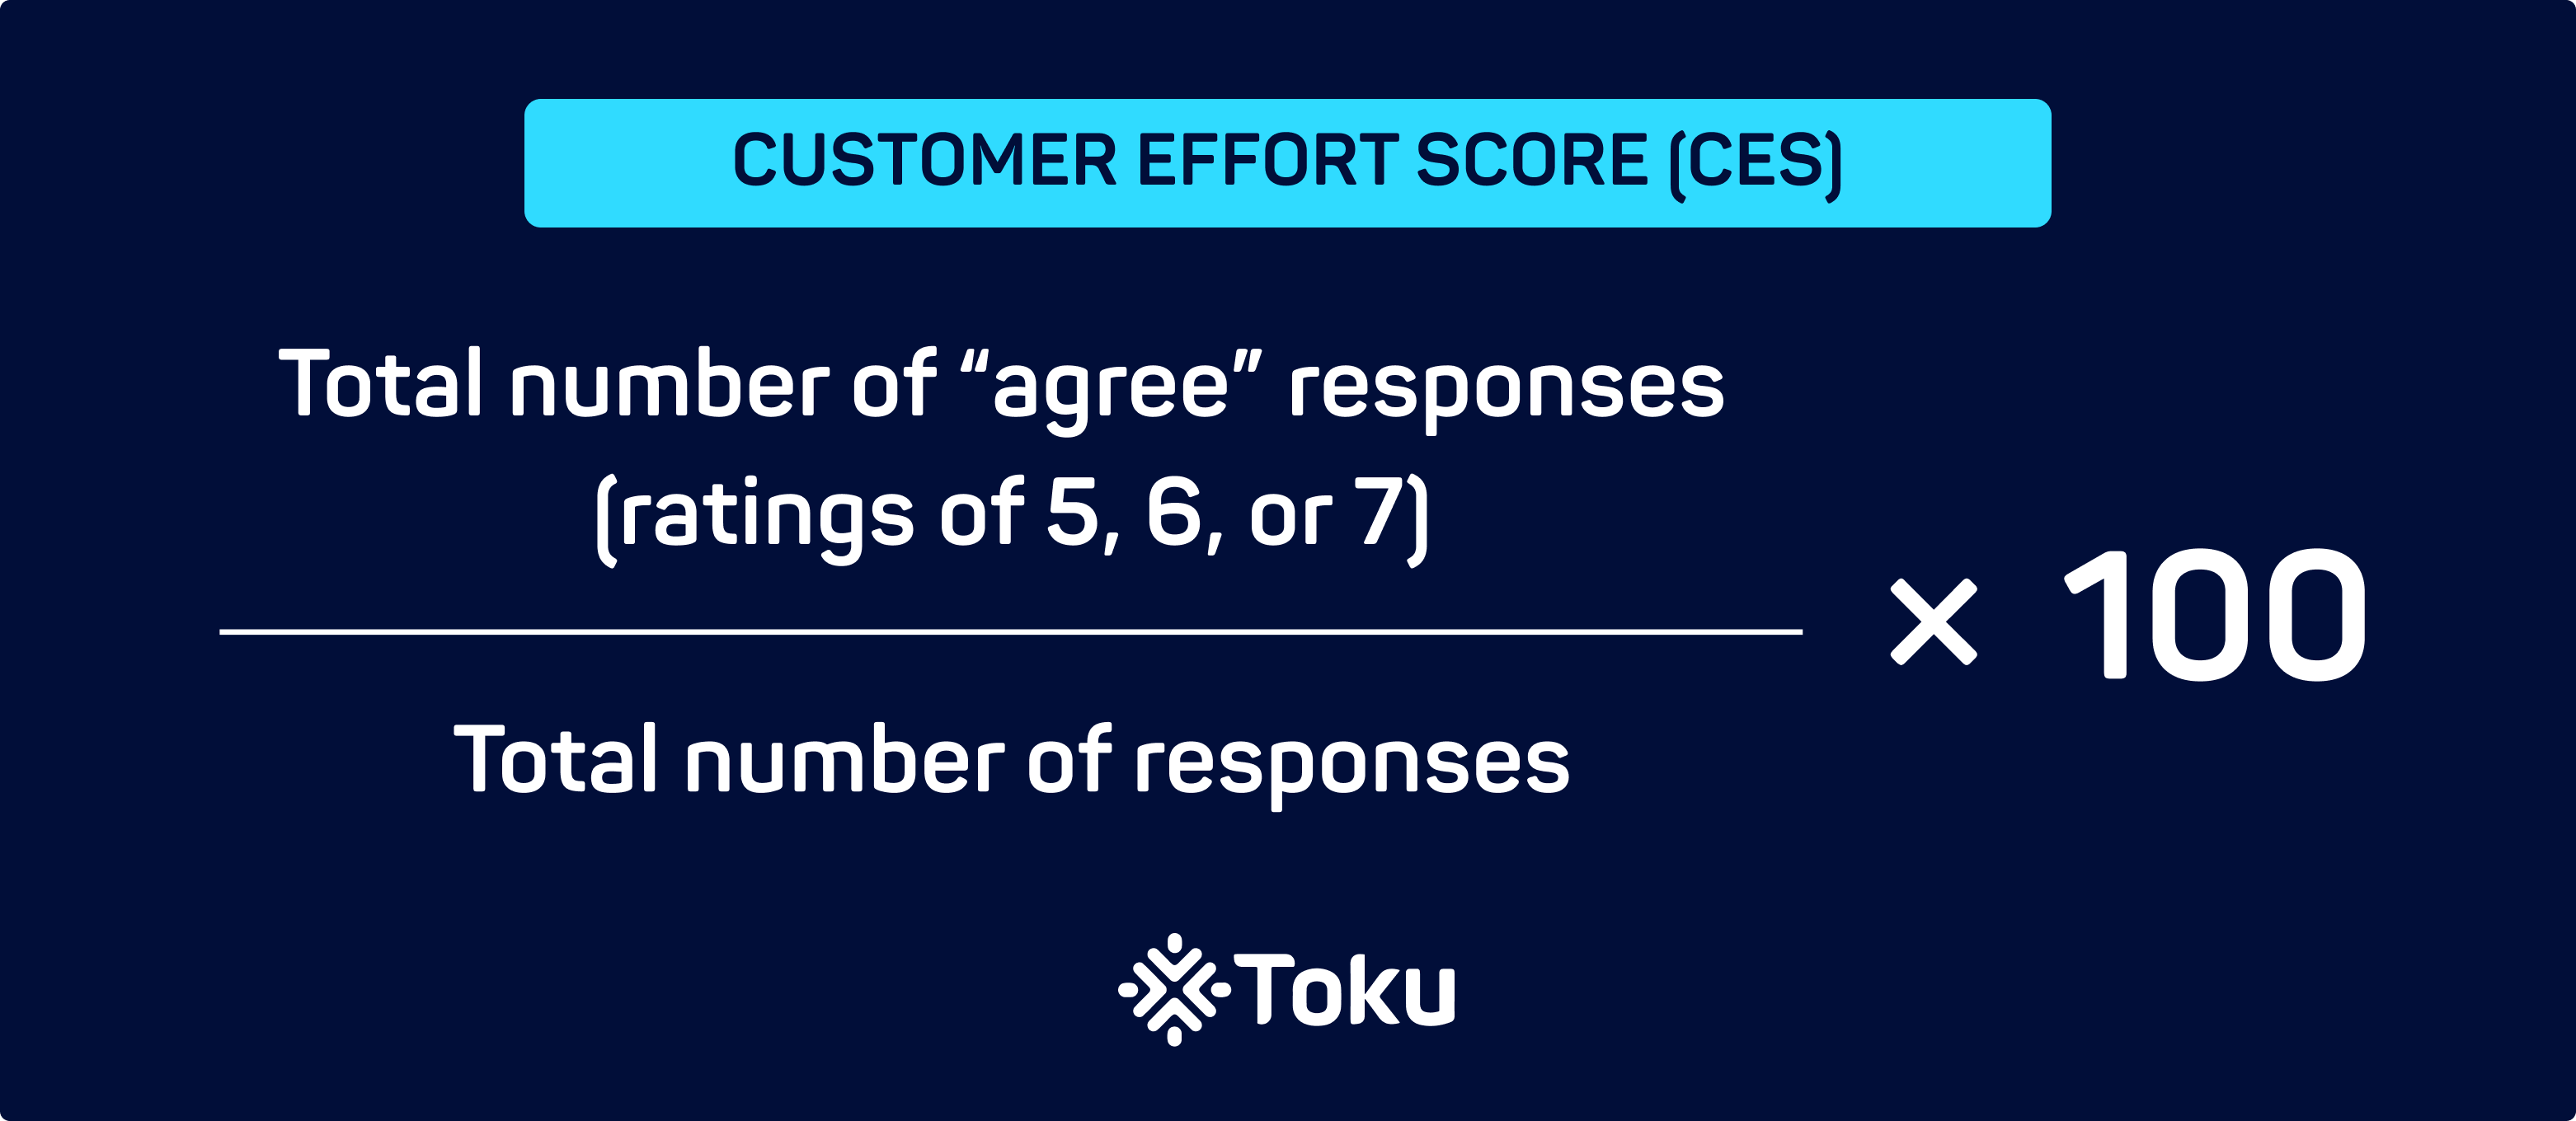
Here’s how to calculate the CES:
- Add up the total number of customers who agree their interaction was easy (these are the ones who rated you 5, 6, or 7).
- Divide the above by the total number of responses then multiply it by 100.
Why does CES matter:
The easier you make it for customers, the more likely they are to return—and recommend your brand. Therefore, a strong CES isn’t just a number; it’s a signpost toward sustainable business growth.
First Call Resolution (FCR)
The FCR is an indispensable metric, typically expressed as a percentage, that measures your ability to resolve customer issues or queries during the first interaction. The pivotal question often deployed in FCR surveys is, “Was your issue resolved in your first interaction with us?” The issues could range from technical support to product inquiries.
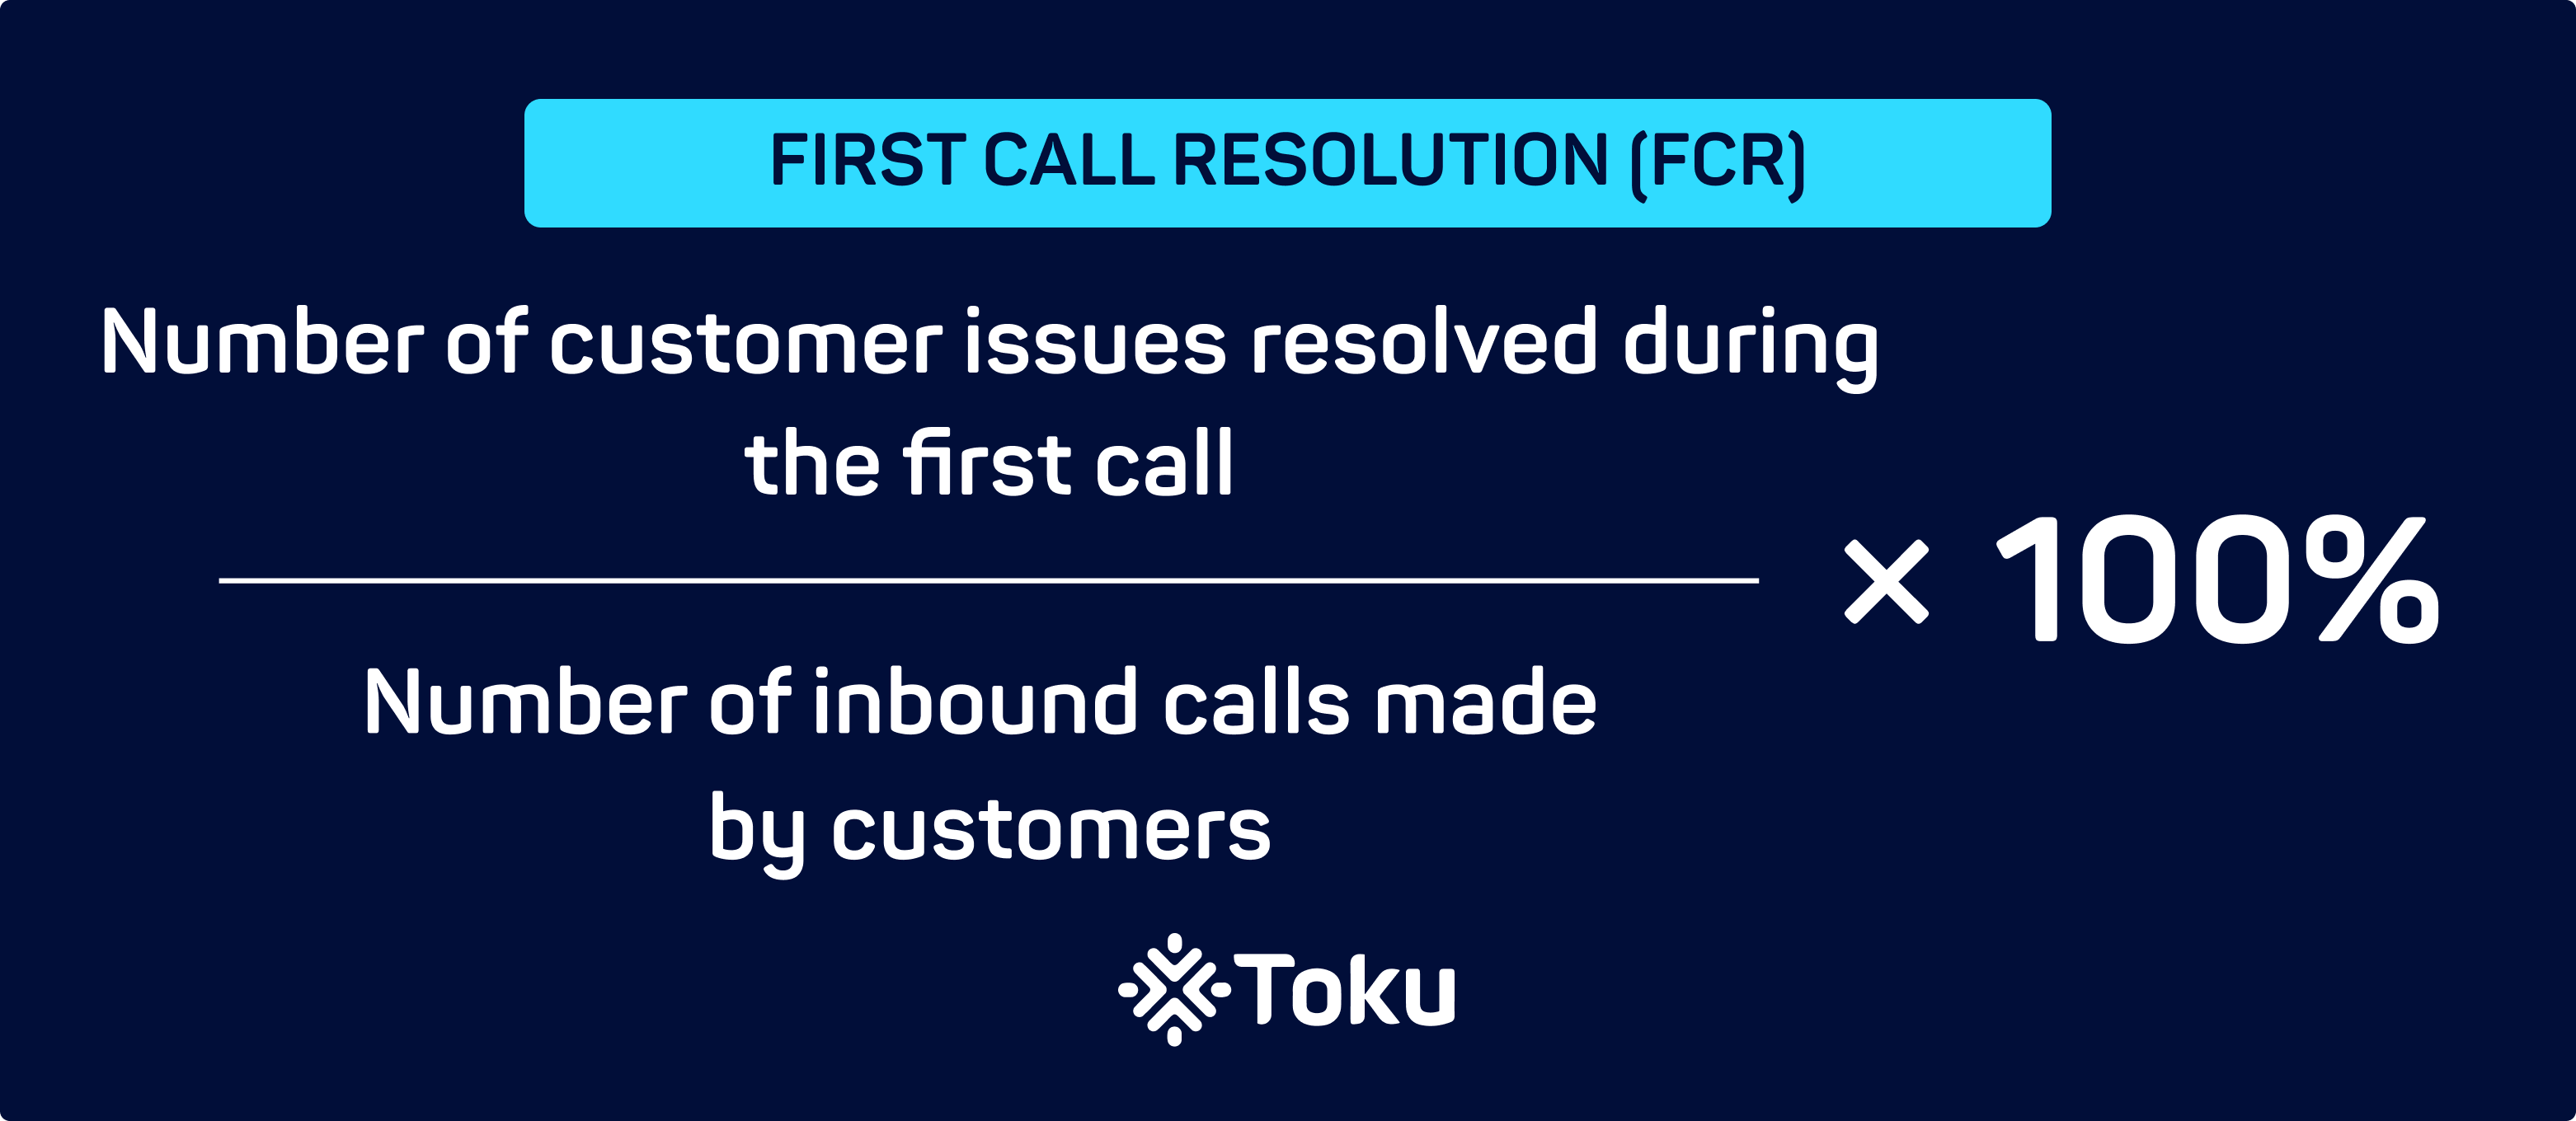
Here’s how to calculate the FCR:
- Identify the number of cases resolved during the first call or interaction.
- Divide this by the total number of inbound calls over the same period.
- Multiply the result by 100 to get the percentage.
Why it matters:
First Call Resolution directly impacts customer satisfaction and operational costs. The higher the FCR rate, the more effective and efficient your contact centre is in dealing with customer issues.
Agent Performance Metrics
Occupancy Rate
Occupancy rate is a crucial metric that estimates how busy your agents are. Expressed as a percentage, it answers the question, “Are my agents too busy or do they have the capacity to handle more work?”
The goal is to find a balance that maximises productivity without overwhelming agents.
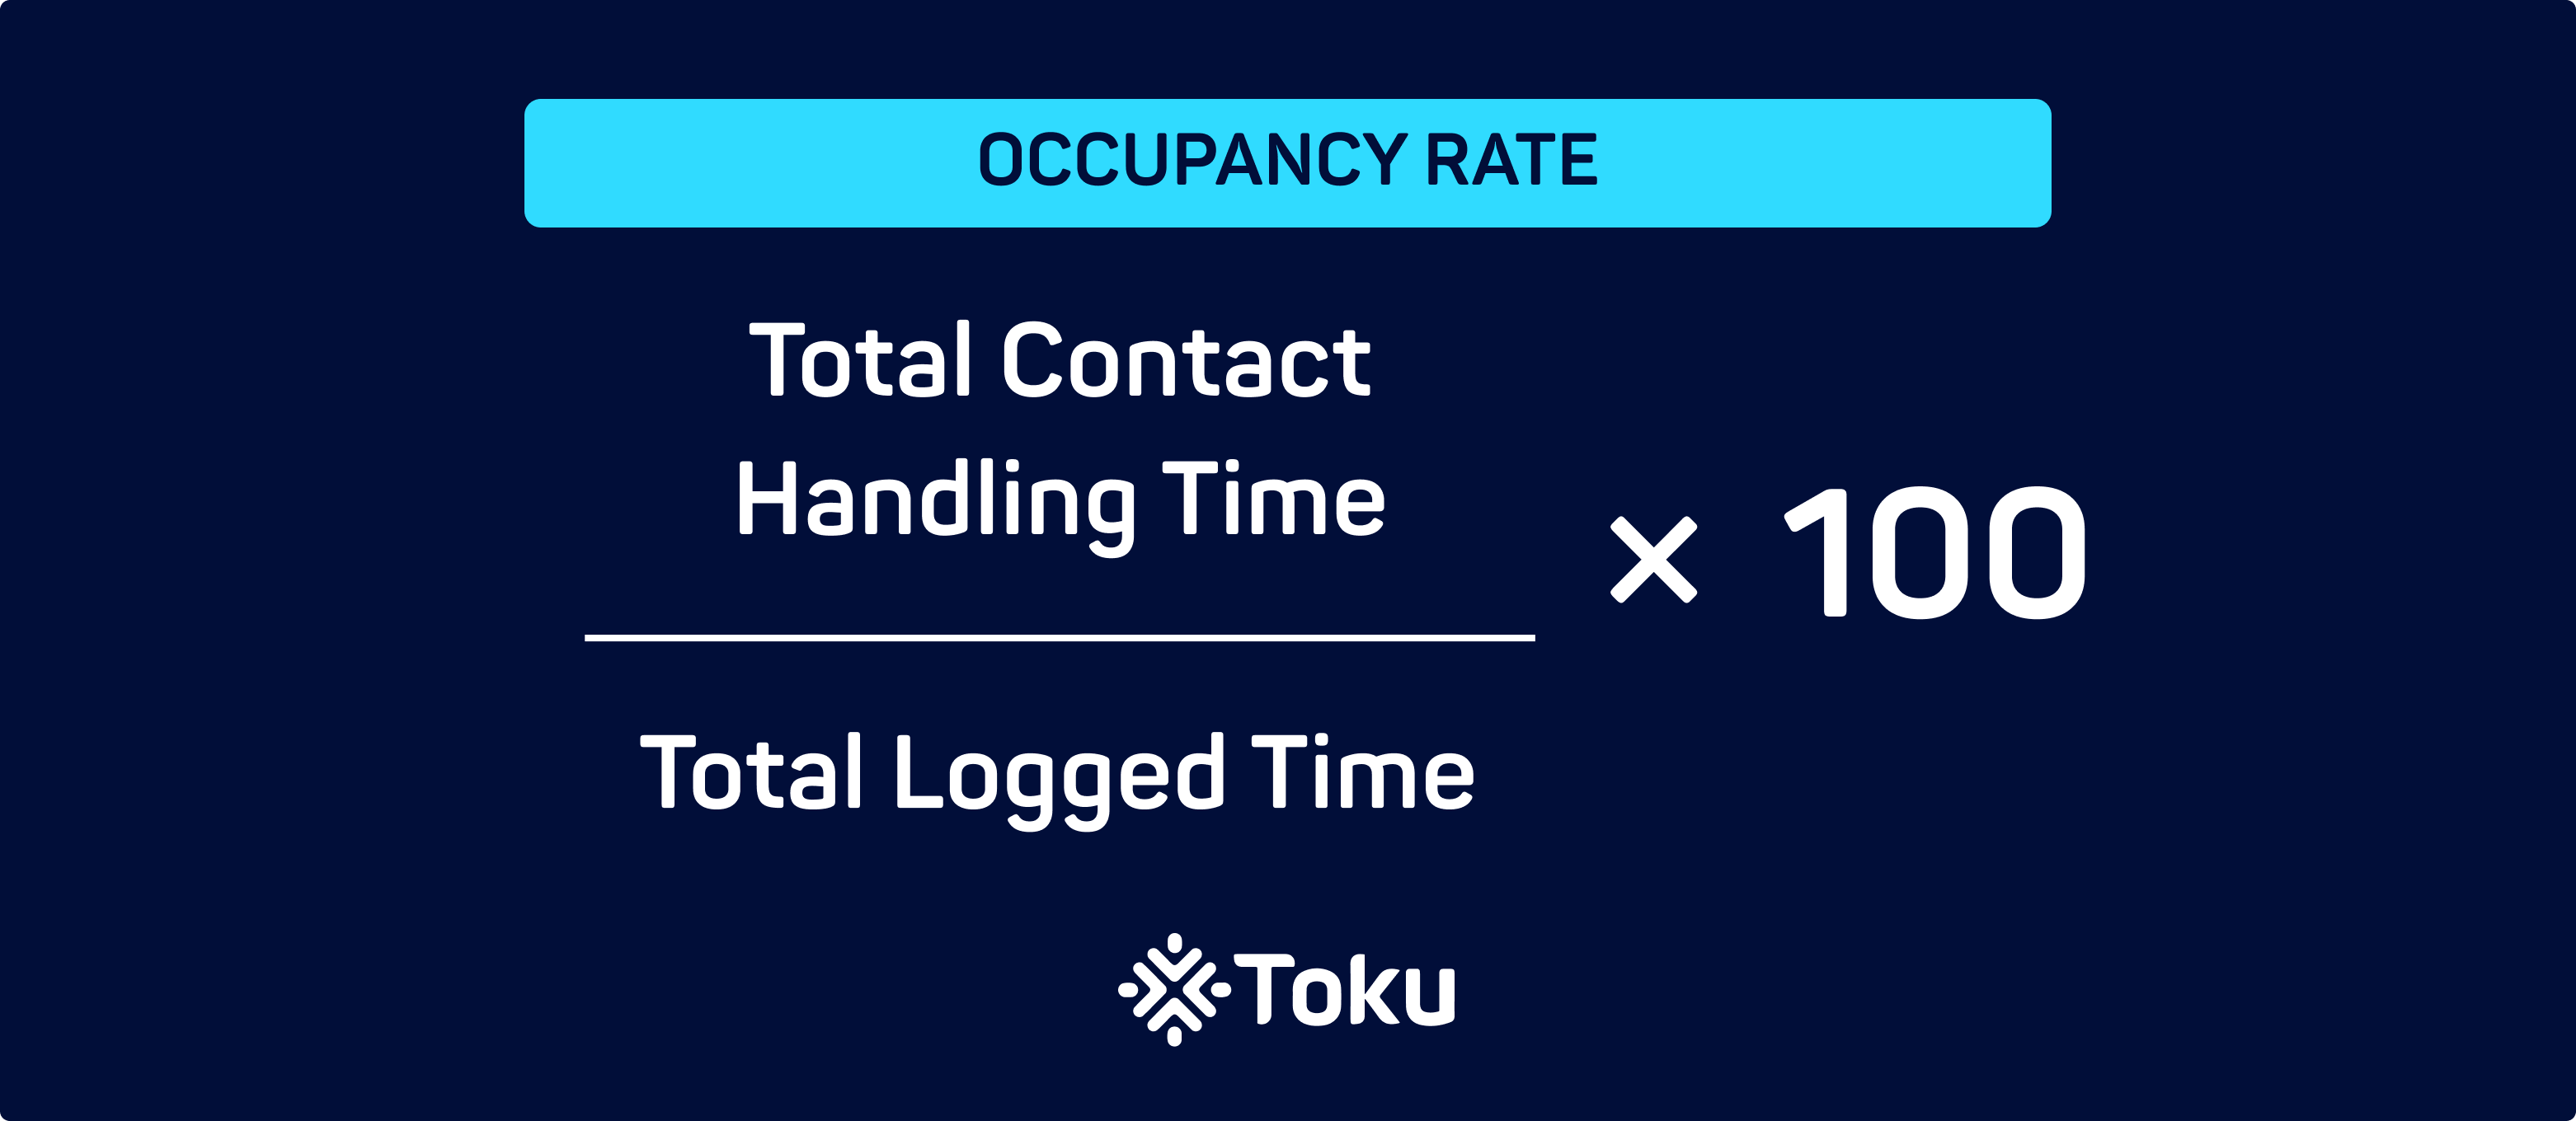
Here’s how to calculate Occupancy Rate:
- Measure the total time agents spend handling customer interactions.
- Divide this by the total logged-in time.
- Multiply the result by 100.
Why it matters:
The occupancy rate shows how busy your customer service agents are. A high rate could mean agents are overloaded and have no time to take a breather in between tickets. This could lead to agent burnout, affecting their performance. On the flipside, if the rate is too low, it suggests the agents are not busy enough and have the capacity to handle more tickets.
Agent Utilisation Rate
The Agent Utilisation Rate is another metric critical for assessing agent productivity, expressed as a percentage. The key question here is, “What proportion of an agent’s work time is spent on core responsibilities versus auxiliary tasks?” This could include time spent on calls, in training, or on administrative duties.
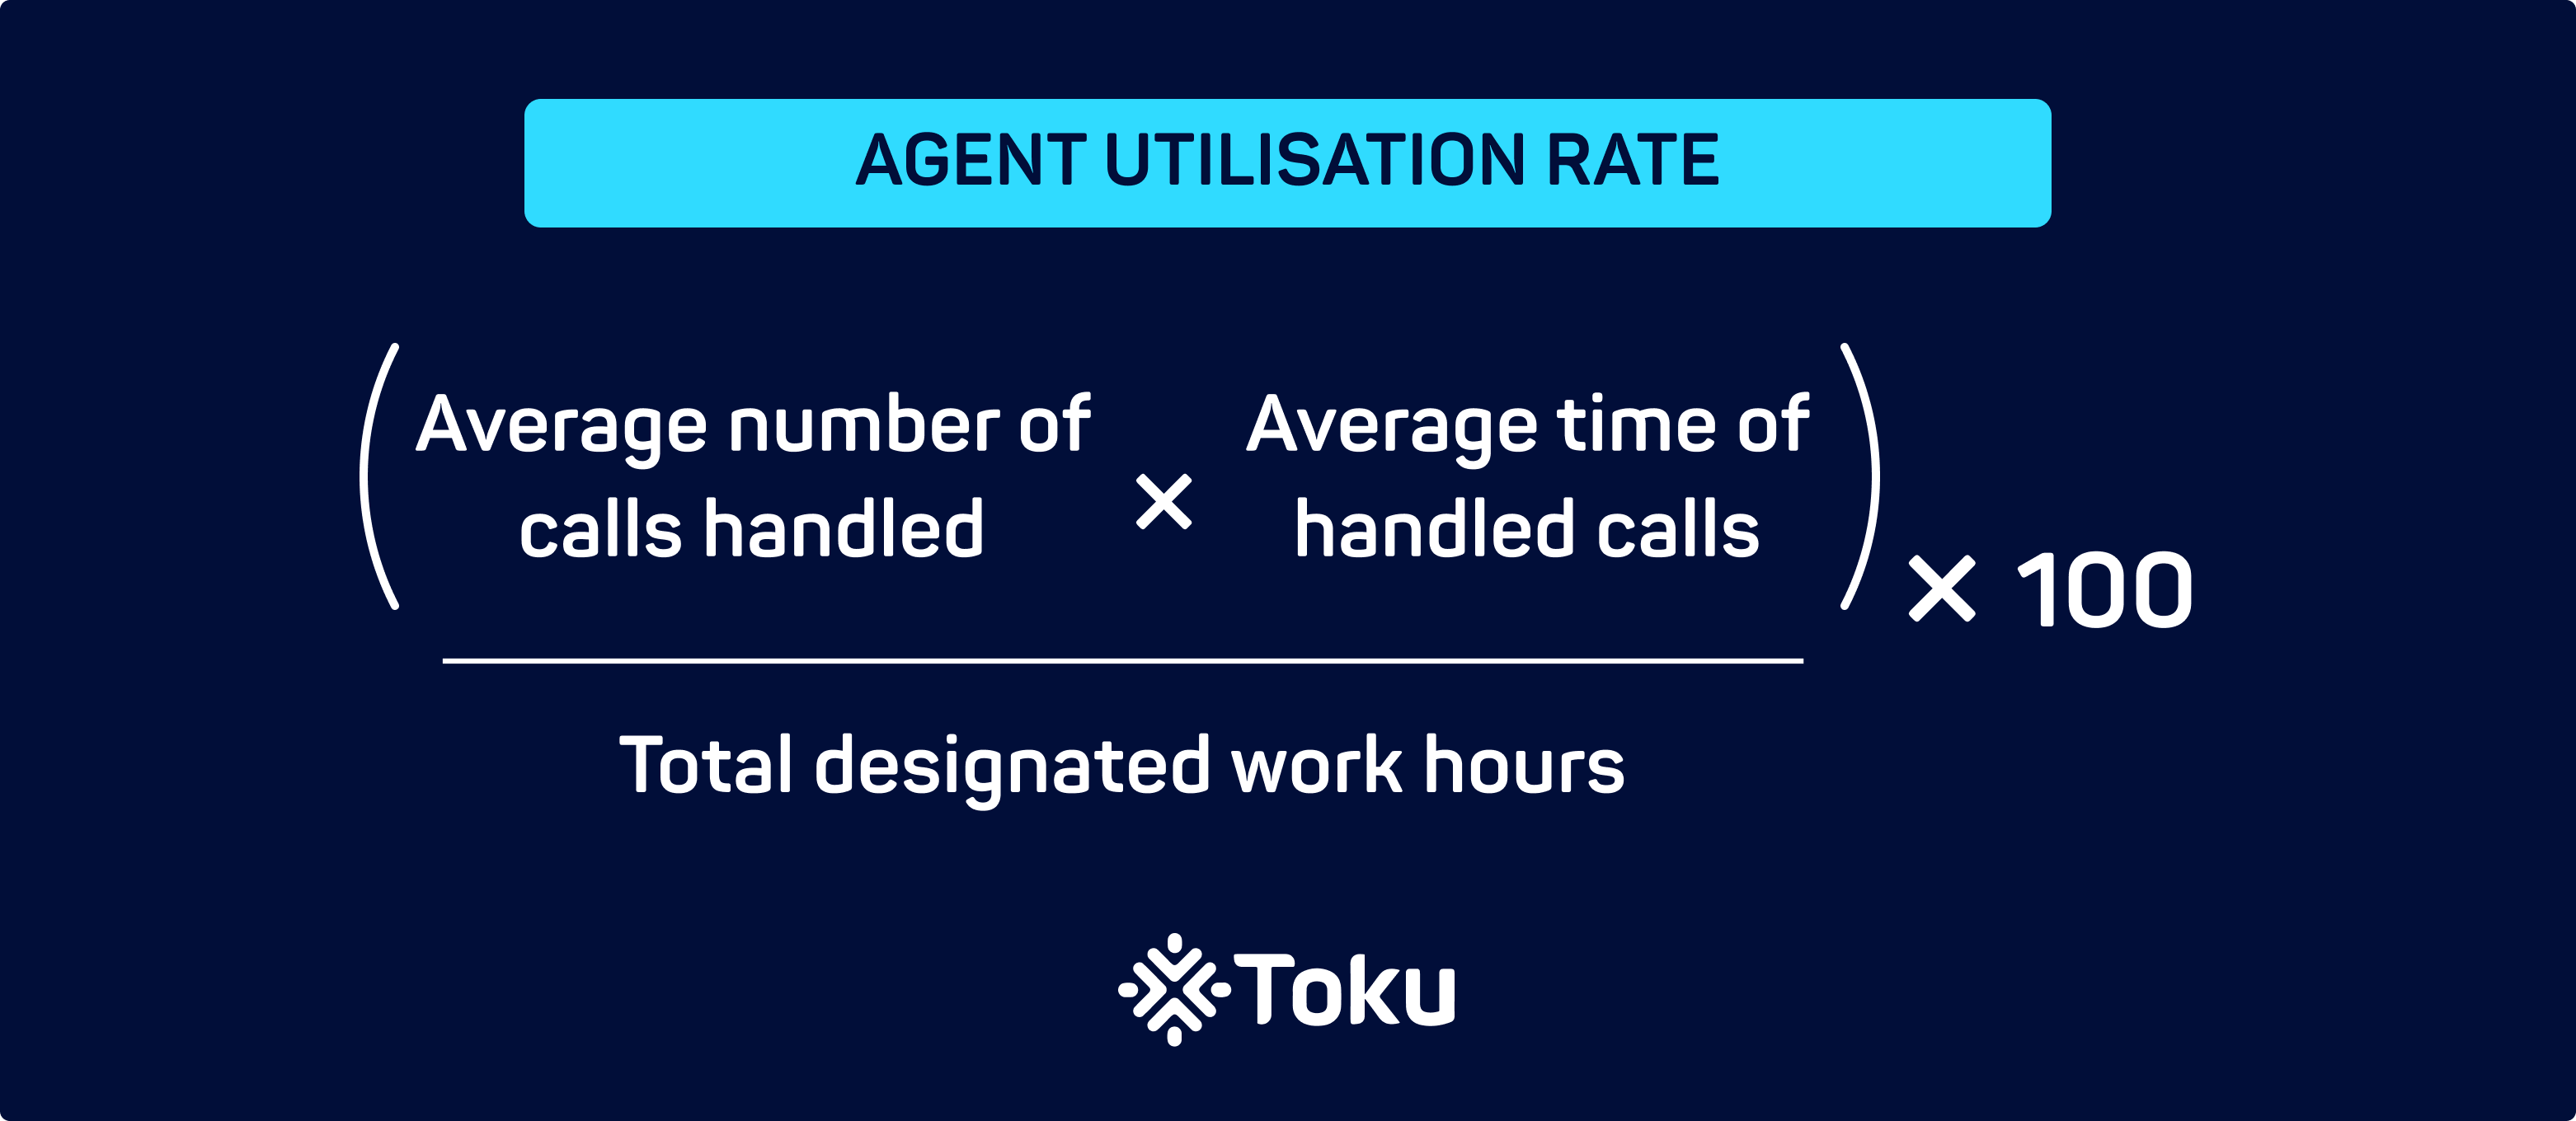
How to calculate Agent Utilisation Rate:
- Multiply the average number of handled calls by the average handle time.
- Divide the above by the total designated work hours within the stipulated period.
- Multiply the number by 100.
Why it matters:
Agent Utilisation Rate offers a comprehensive view of how effectively your agents are being employed. A high rate indicates effective task delegation and a streamlined operation, which can ultimately lead to better customer experiences and stronger business performance.
Average Handling Time (AHT)

Get monthly nuggets of wisdom for all things customer experience in your inbox
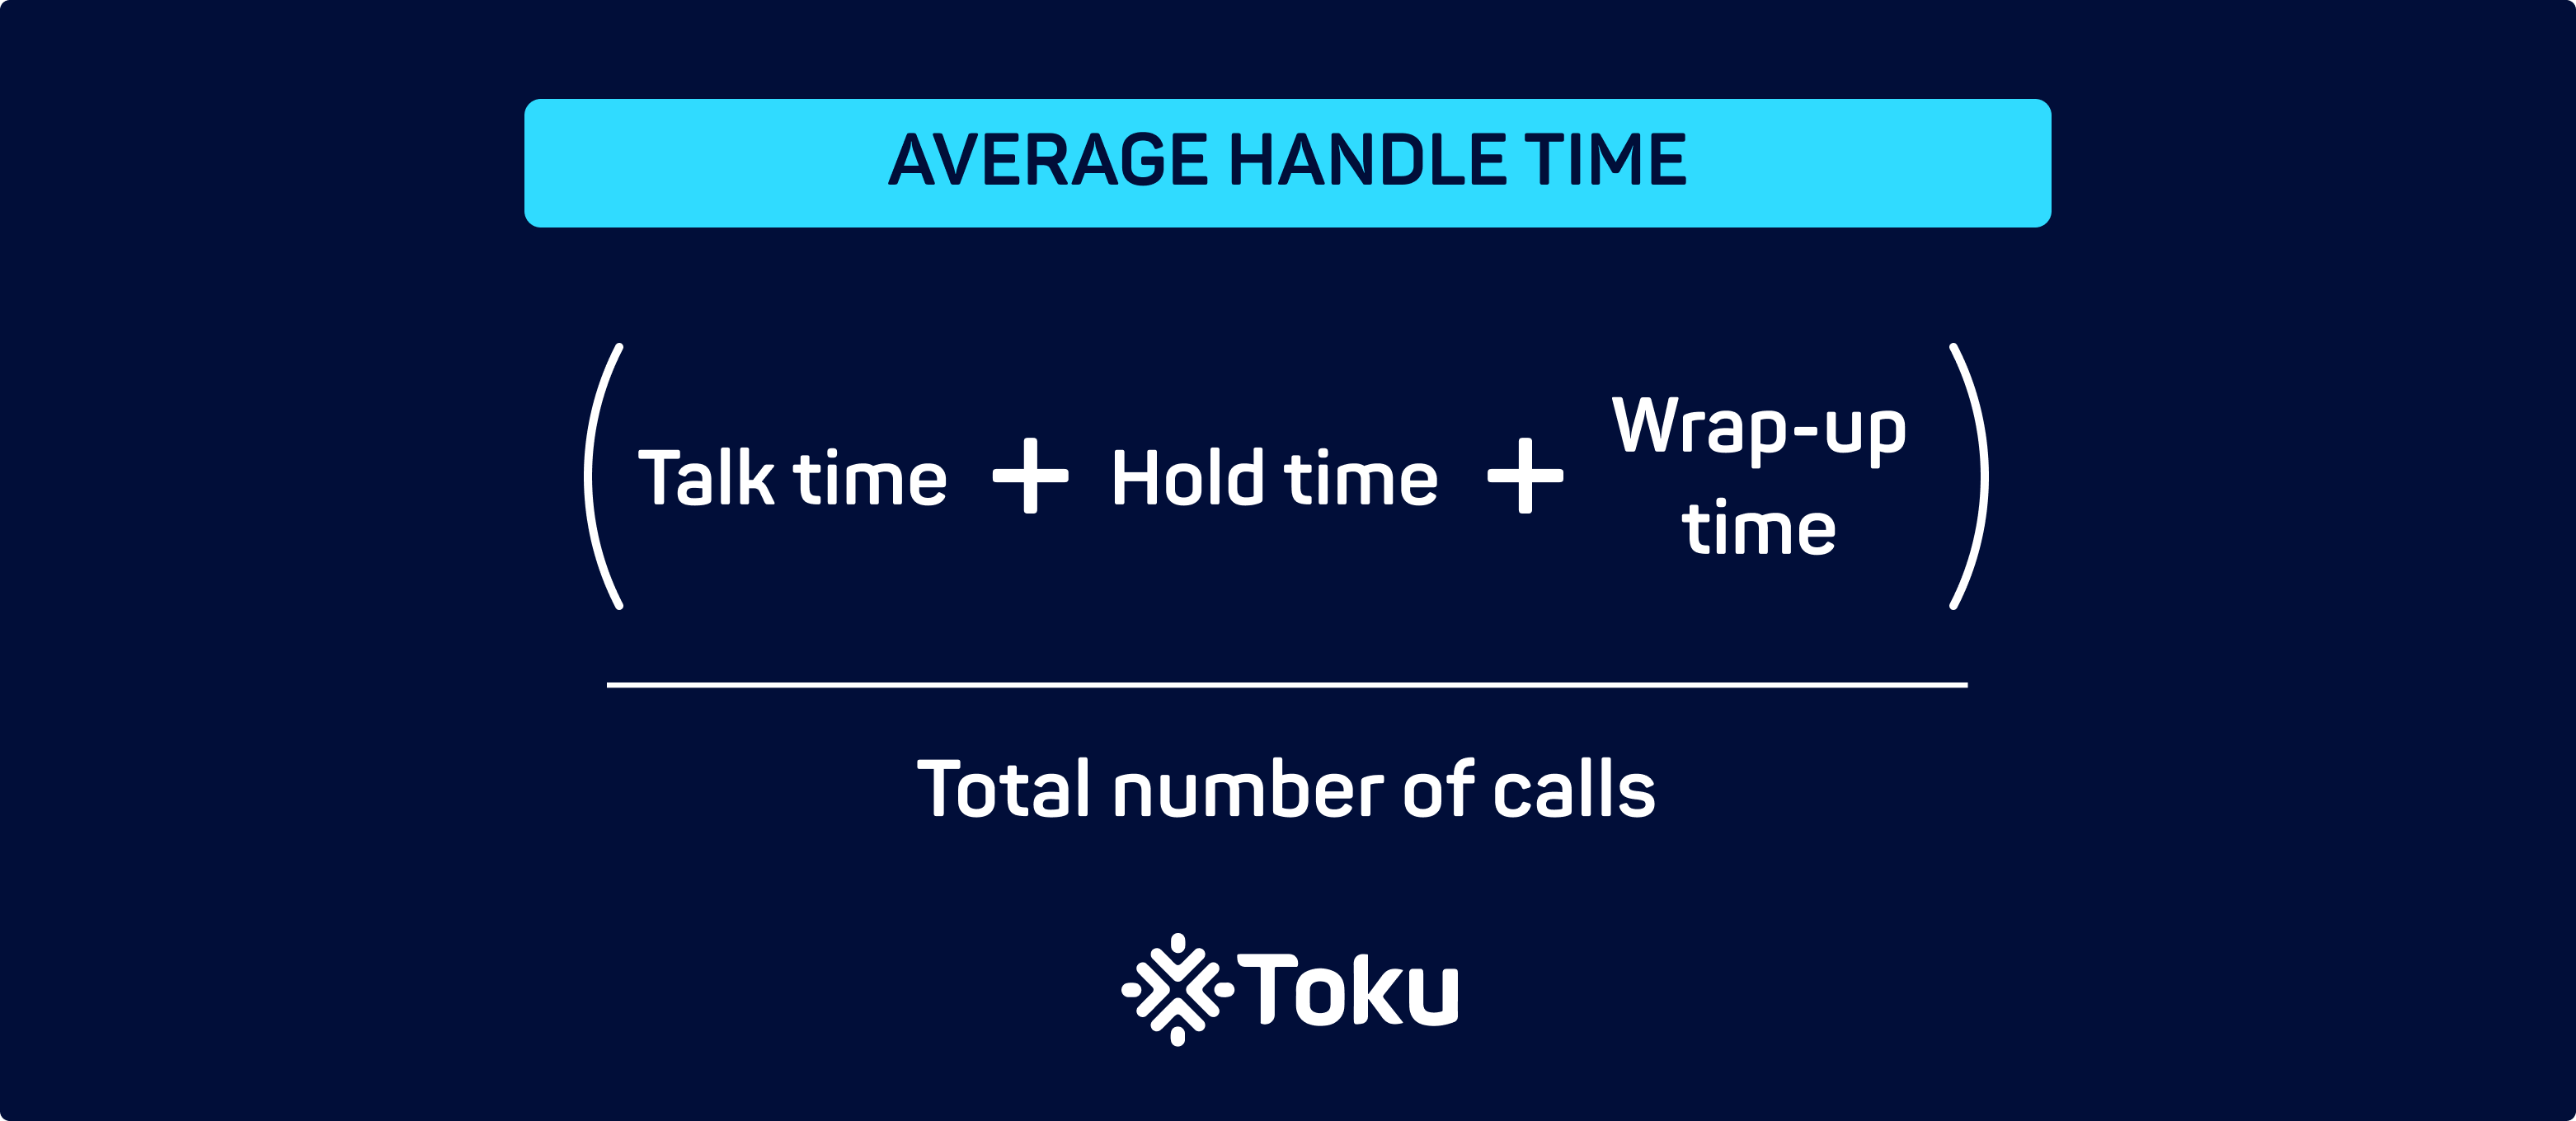
Average Handling Time (AHT) is an indispensable metric for gauging the efficiency of your contact centre. It measures the total time an agent spends on a call from initiation to closure, including hold times and after-call work. To calculate AHT, sum the total handle time and divide it by the total number of resolved calls.
Why does AHT matter:
AHT offers insight into your contact centre agents’ proficiency. A consistently high AHT could signal that agents need additional training or that there’s a more systemic issue with the process or product knowledge. A low AHT, on the other hand, might mean agents are rushing through calls without adequately resolving issues, which could negatively impact customer satisfaction.
Full Resolution Time
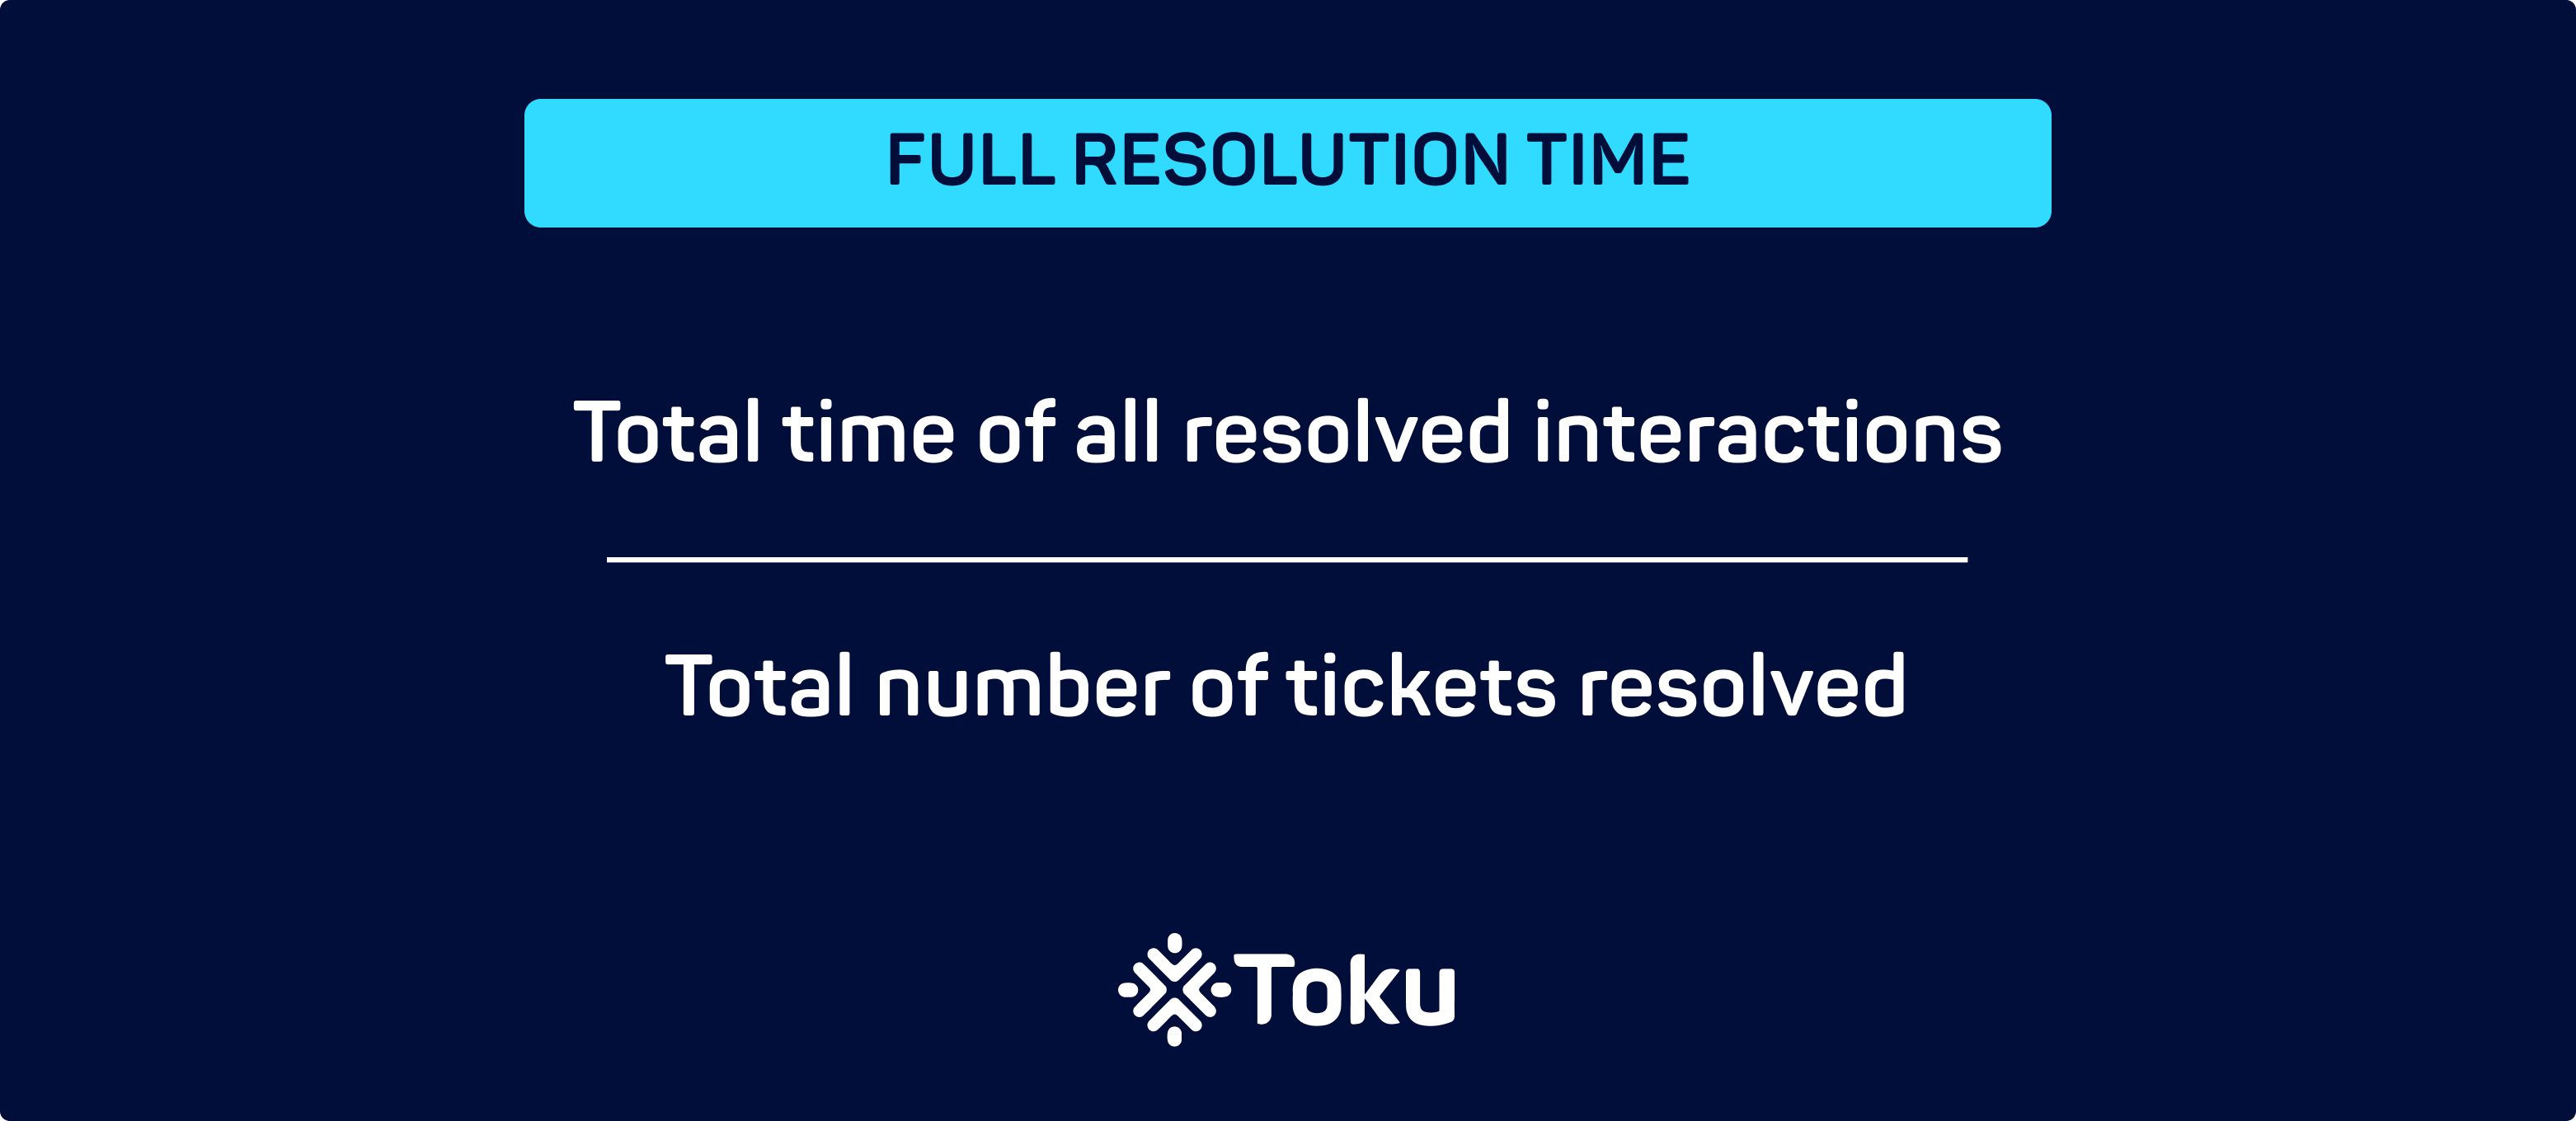
Full Resolution Time refers to the total time taken from the point a customer makes an inquiry or lodges a complaint to the point their issue is fully resolved. It’s calculated by clocking the span from initial ticket creation to its final resolution status.
Here’s how to calculate Full Resolution Time:
- Add up the total time of all resolved interactions.
- Divide this by the total number of tickets resolved.
Why does full resolution time matter:
This metric serves as an overarching indicator of your operational effectiveness. A prolonged Full Resolution Time could hint at bottlenecks in your support process, while a short Full Resolution Time suggests a smooth, efficient customer journey. Either way, understanding this metric allows for strategic adjustments, impacting both customer satisfaction and operational costs.
Average Time In Queue
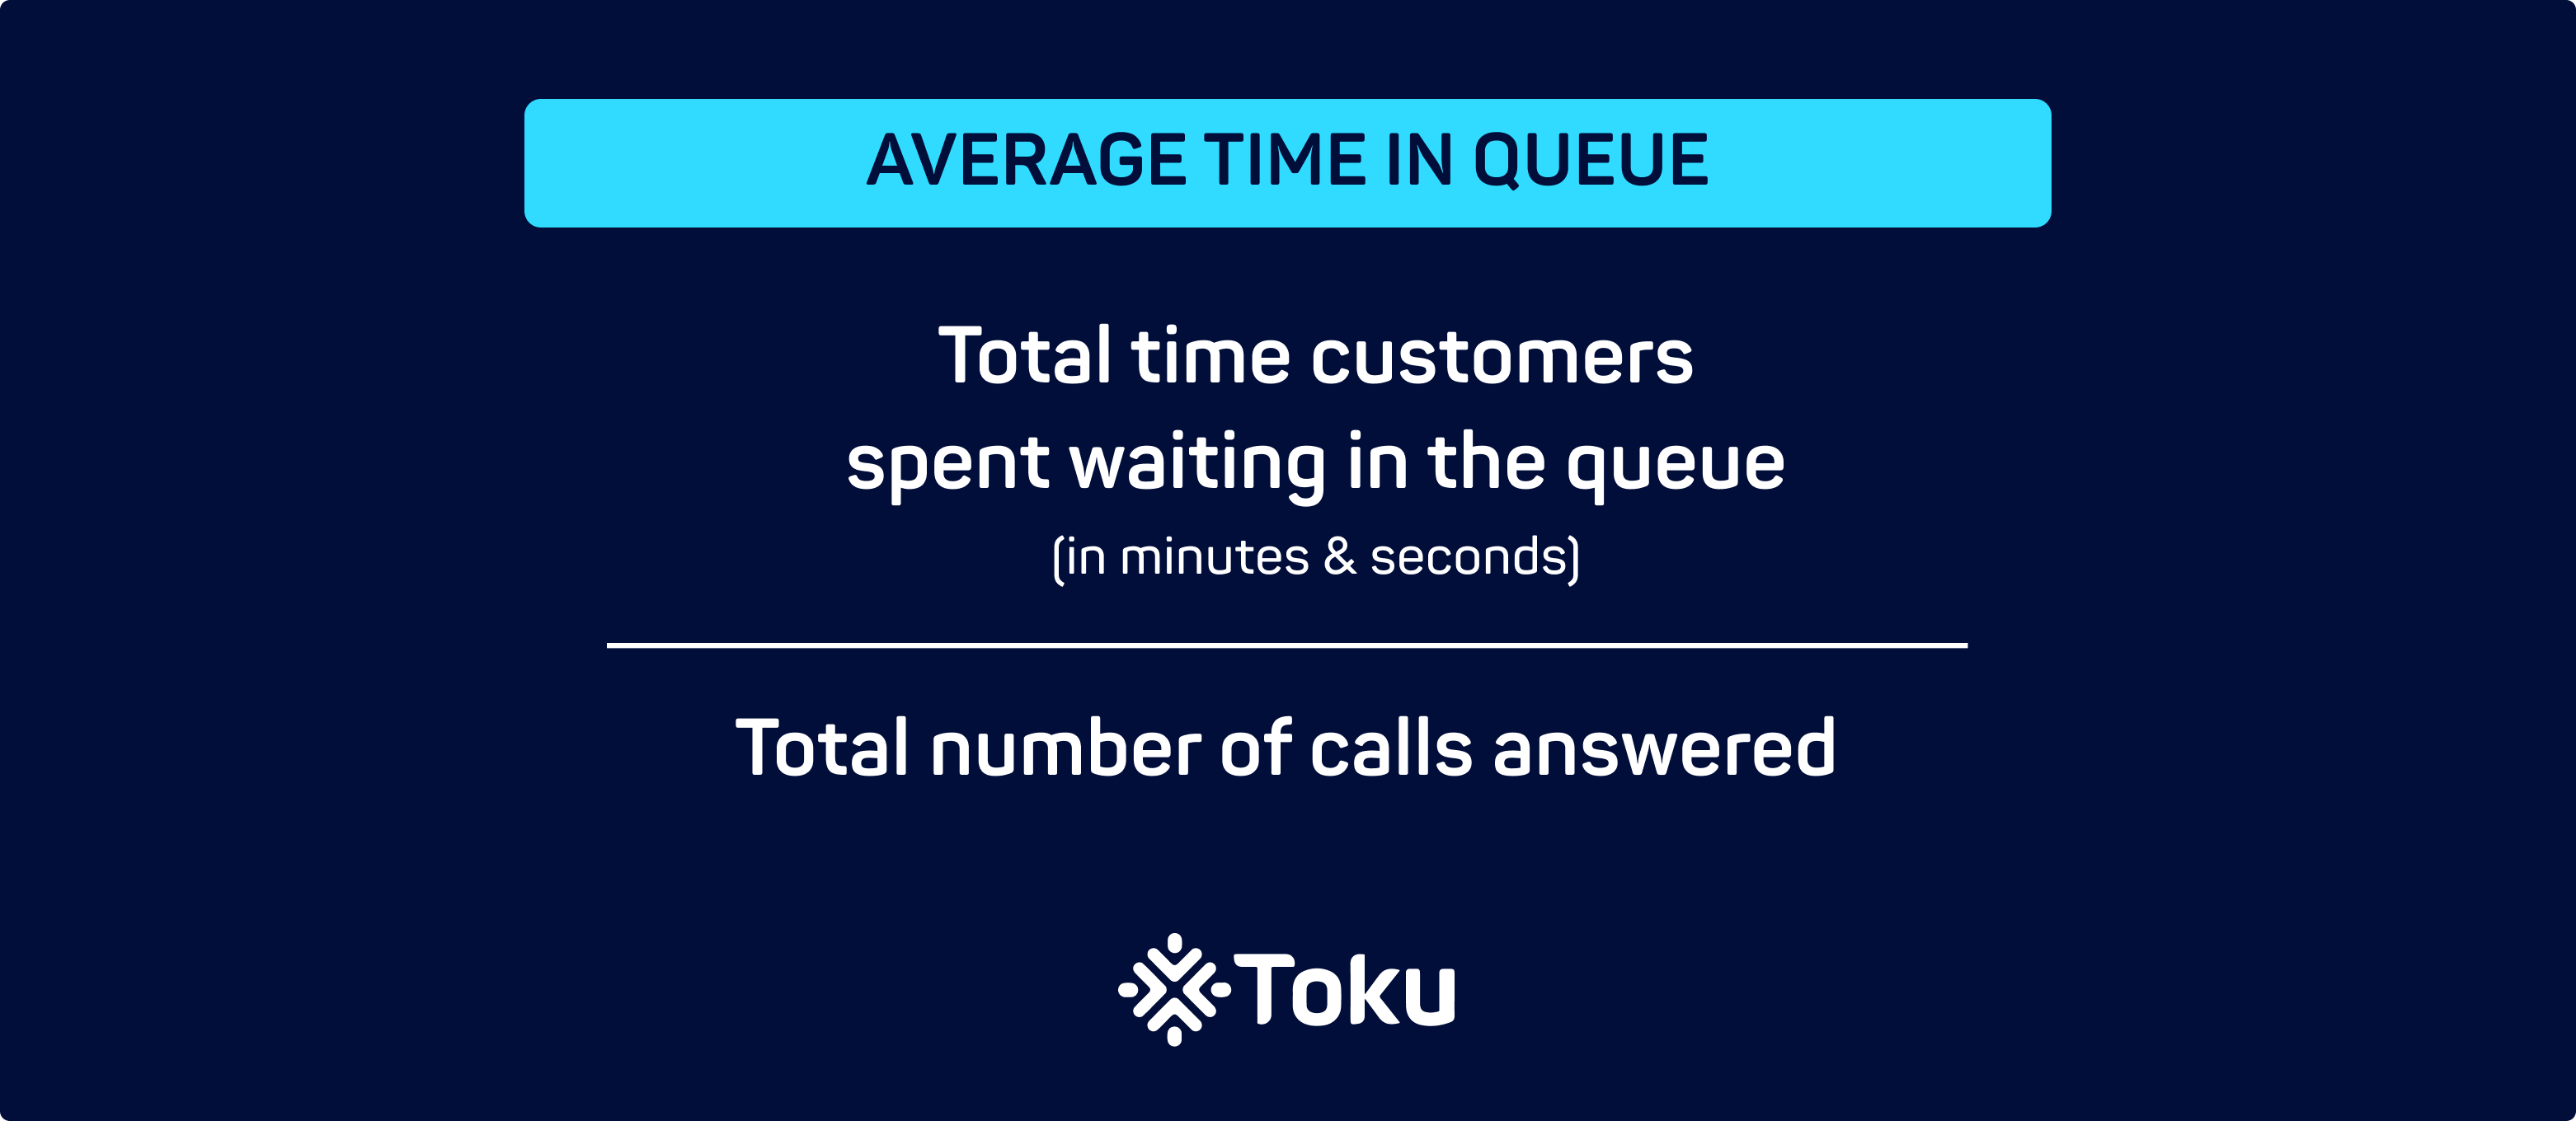
The Average Time in Queue is a vital metric, represented in minutes and seconds, that measures the duration customers have to wait before speaking to an agent. The key question here is often implicit, and gauged through customer feedback after the call: “How long did you have to wait to have your issue addressed?” The waiting time could pertain to anything from product enquiries to complaint resolutions.
Here’s how to calculate the Average Time in Queue:
- Add up the total wait time for all calls within a given period.
- Divide this sum by the total number of calls answered in that same period.
Why it matters:
The shorter the waiting time, the better the customer experience. A low Average Time in Queue can lead to higher customer satisfaction rates and may even influence the overall perception of your brand. Thus, a favourable Average Time in Queue is not just a metric—it’s a benchmark for customer satisfaction and a cornerstone for building customer loyalty.
Early Perception Metrics
Average Call Abandonment Rate
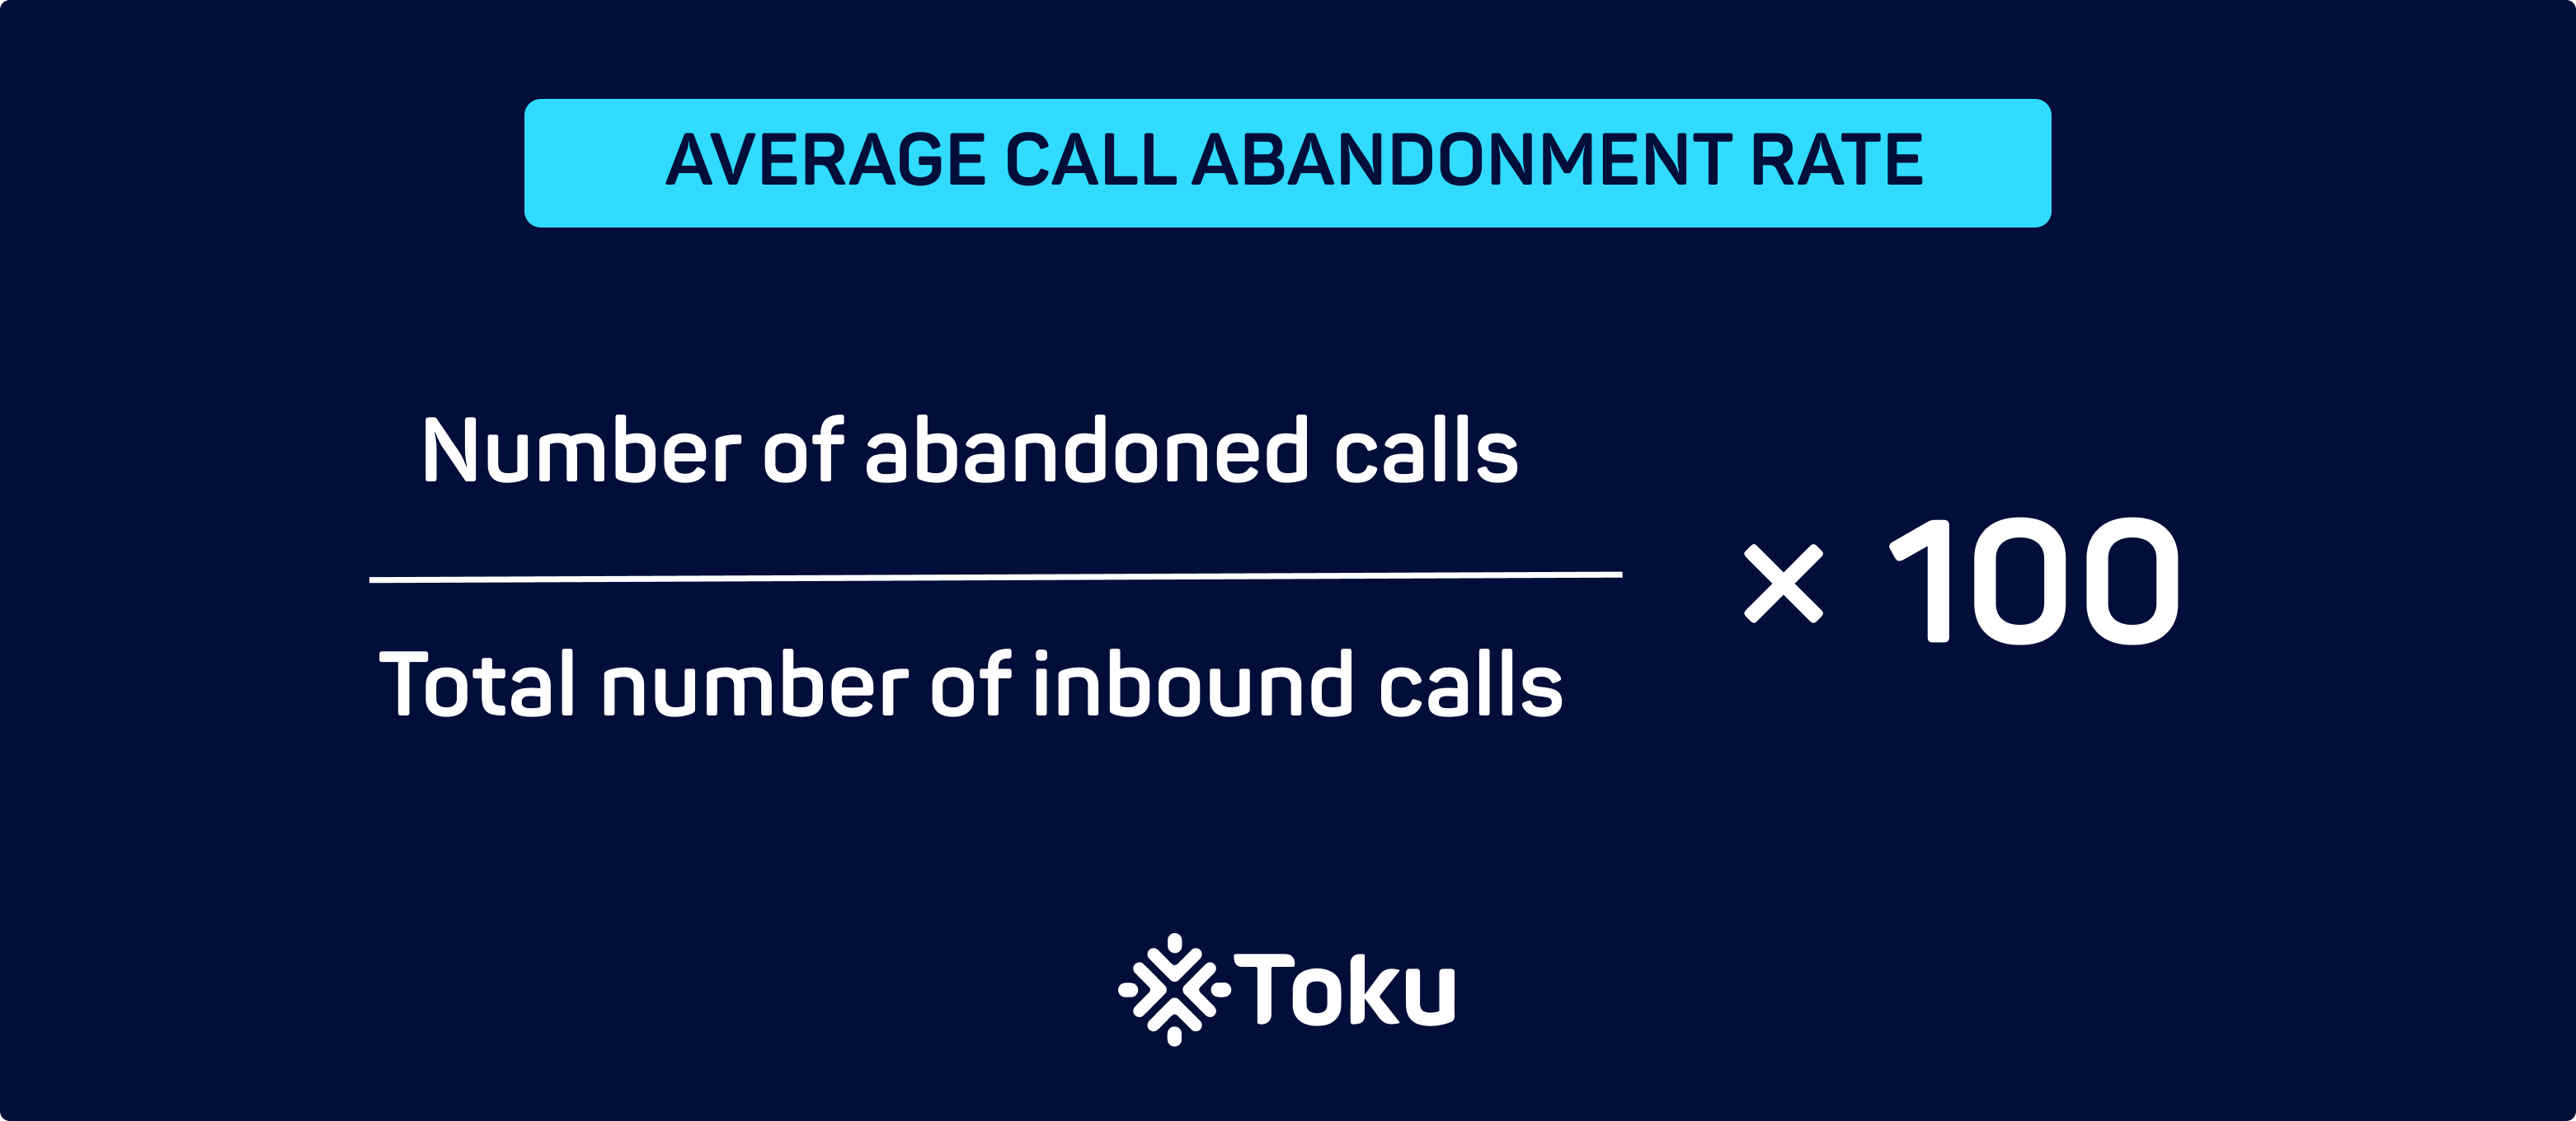
The Average Call Abandonment Rate is an essential metric, typically expressed as a percentage, that highlights how often customers hang up before connecting with an agent. The central question behind this metric is, “What percentage of callers abandon their calls before reaching an agent?”
This can be due to several reasons, such as long wait times or complicated IVR menus.
Here’s how to calculate Average Call Abandonment Rate:
- Identify the calls abandoned by customers and add them up.
- Divide this by the total number of incoming calls.
- Multiply the result by 100.
Why it matters:
A high call abandonment rate is a red flag, signaling dissatisfaction among your customer base and possibly leading to churn. Conversely, a low rate can indicate efficient operations and high customer satisfaction, making it a key factor for business retention and growth.
Service Level Rate (SLR)
Service Level Rate (SLR) serves as a critical performance indicator for contact centres. SLR sets the bar for what level of service is expected based on standard industry benchmarks, such as “Answering 90% of calls within 20 seconds (or 4 rings)” or “Responding to 80% of chats within 10 seconds.”
Naturally, these standards can be customised according to each contact centre’s unique operational needs and customer expectations.
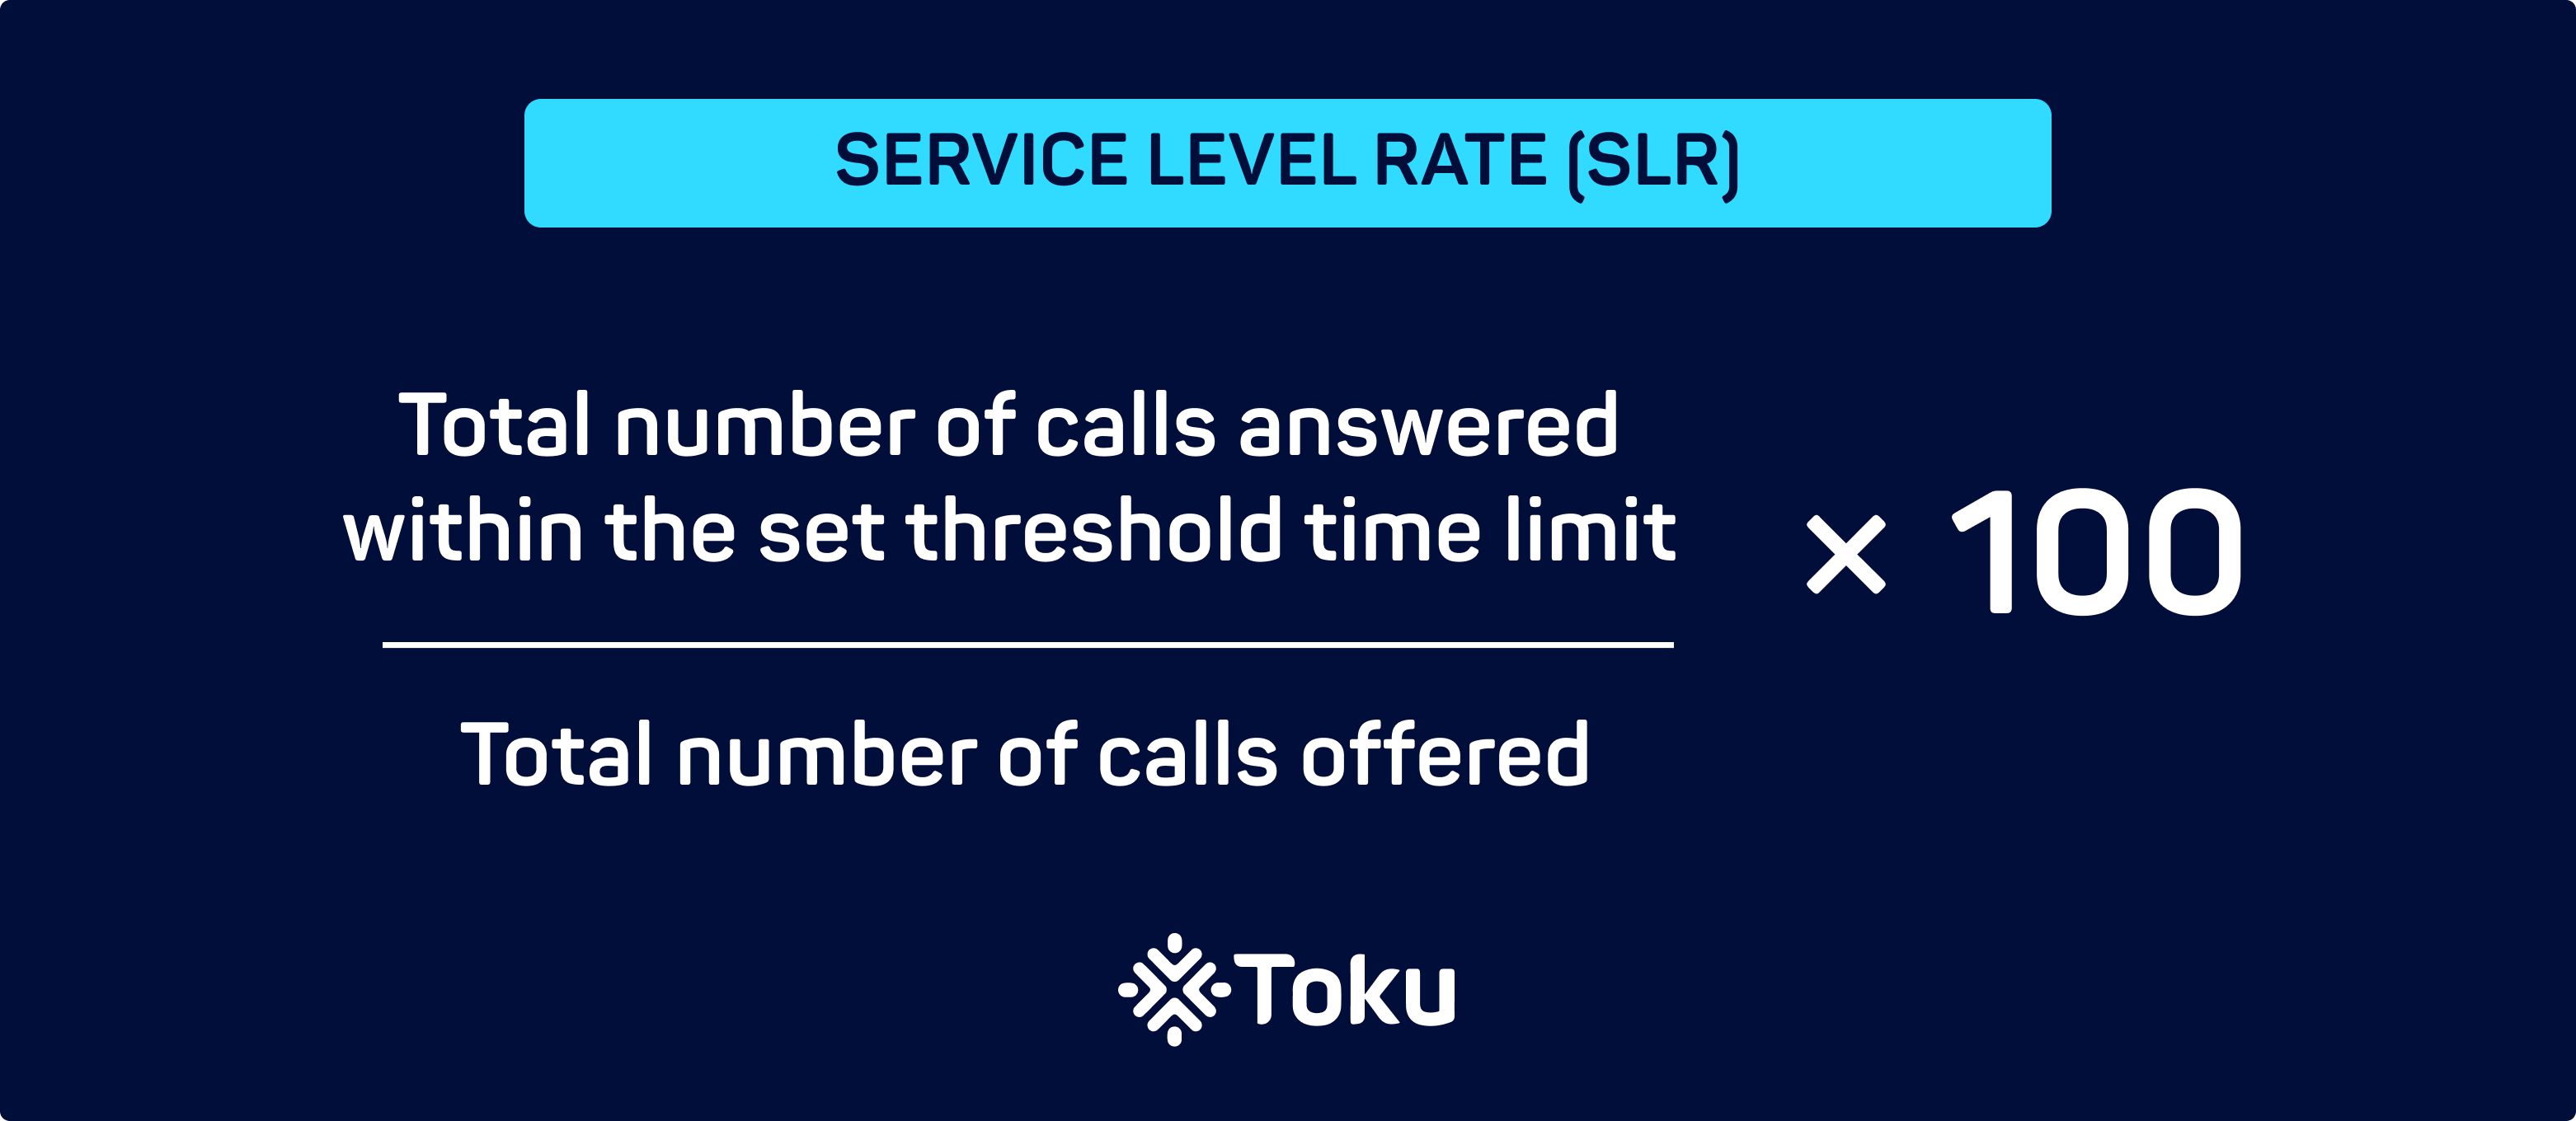
Here’s how to calculate SLR:
- Sum the total number of calls answered within the set threshold time limit.
- Divide this by the total number of calls offered.
- Multiply the result by 100 to obtain the SLR percentage.
Why does SLR matter:
It provides a quantifiable metric for assessing service quality. Continual monitoring of SLR helps managers spot bottlenecks, allocate resources efficiently, commend standout team members, and ensure the contact centre is not merely meeting but surpassing customer expectations.
Average First Response Time
First Response Time is the duration it takes for a customer to receive an initial response after submitting a ticket or query. This metric estimates the average time taken between the customer’s first contact and the agent’s initial reply.
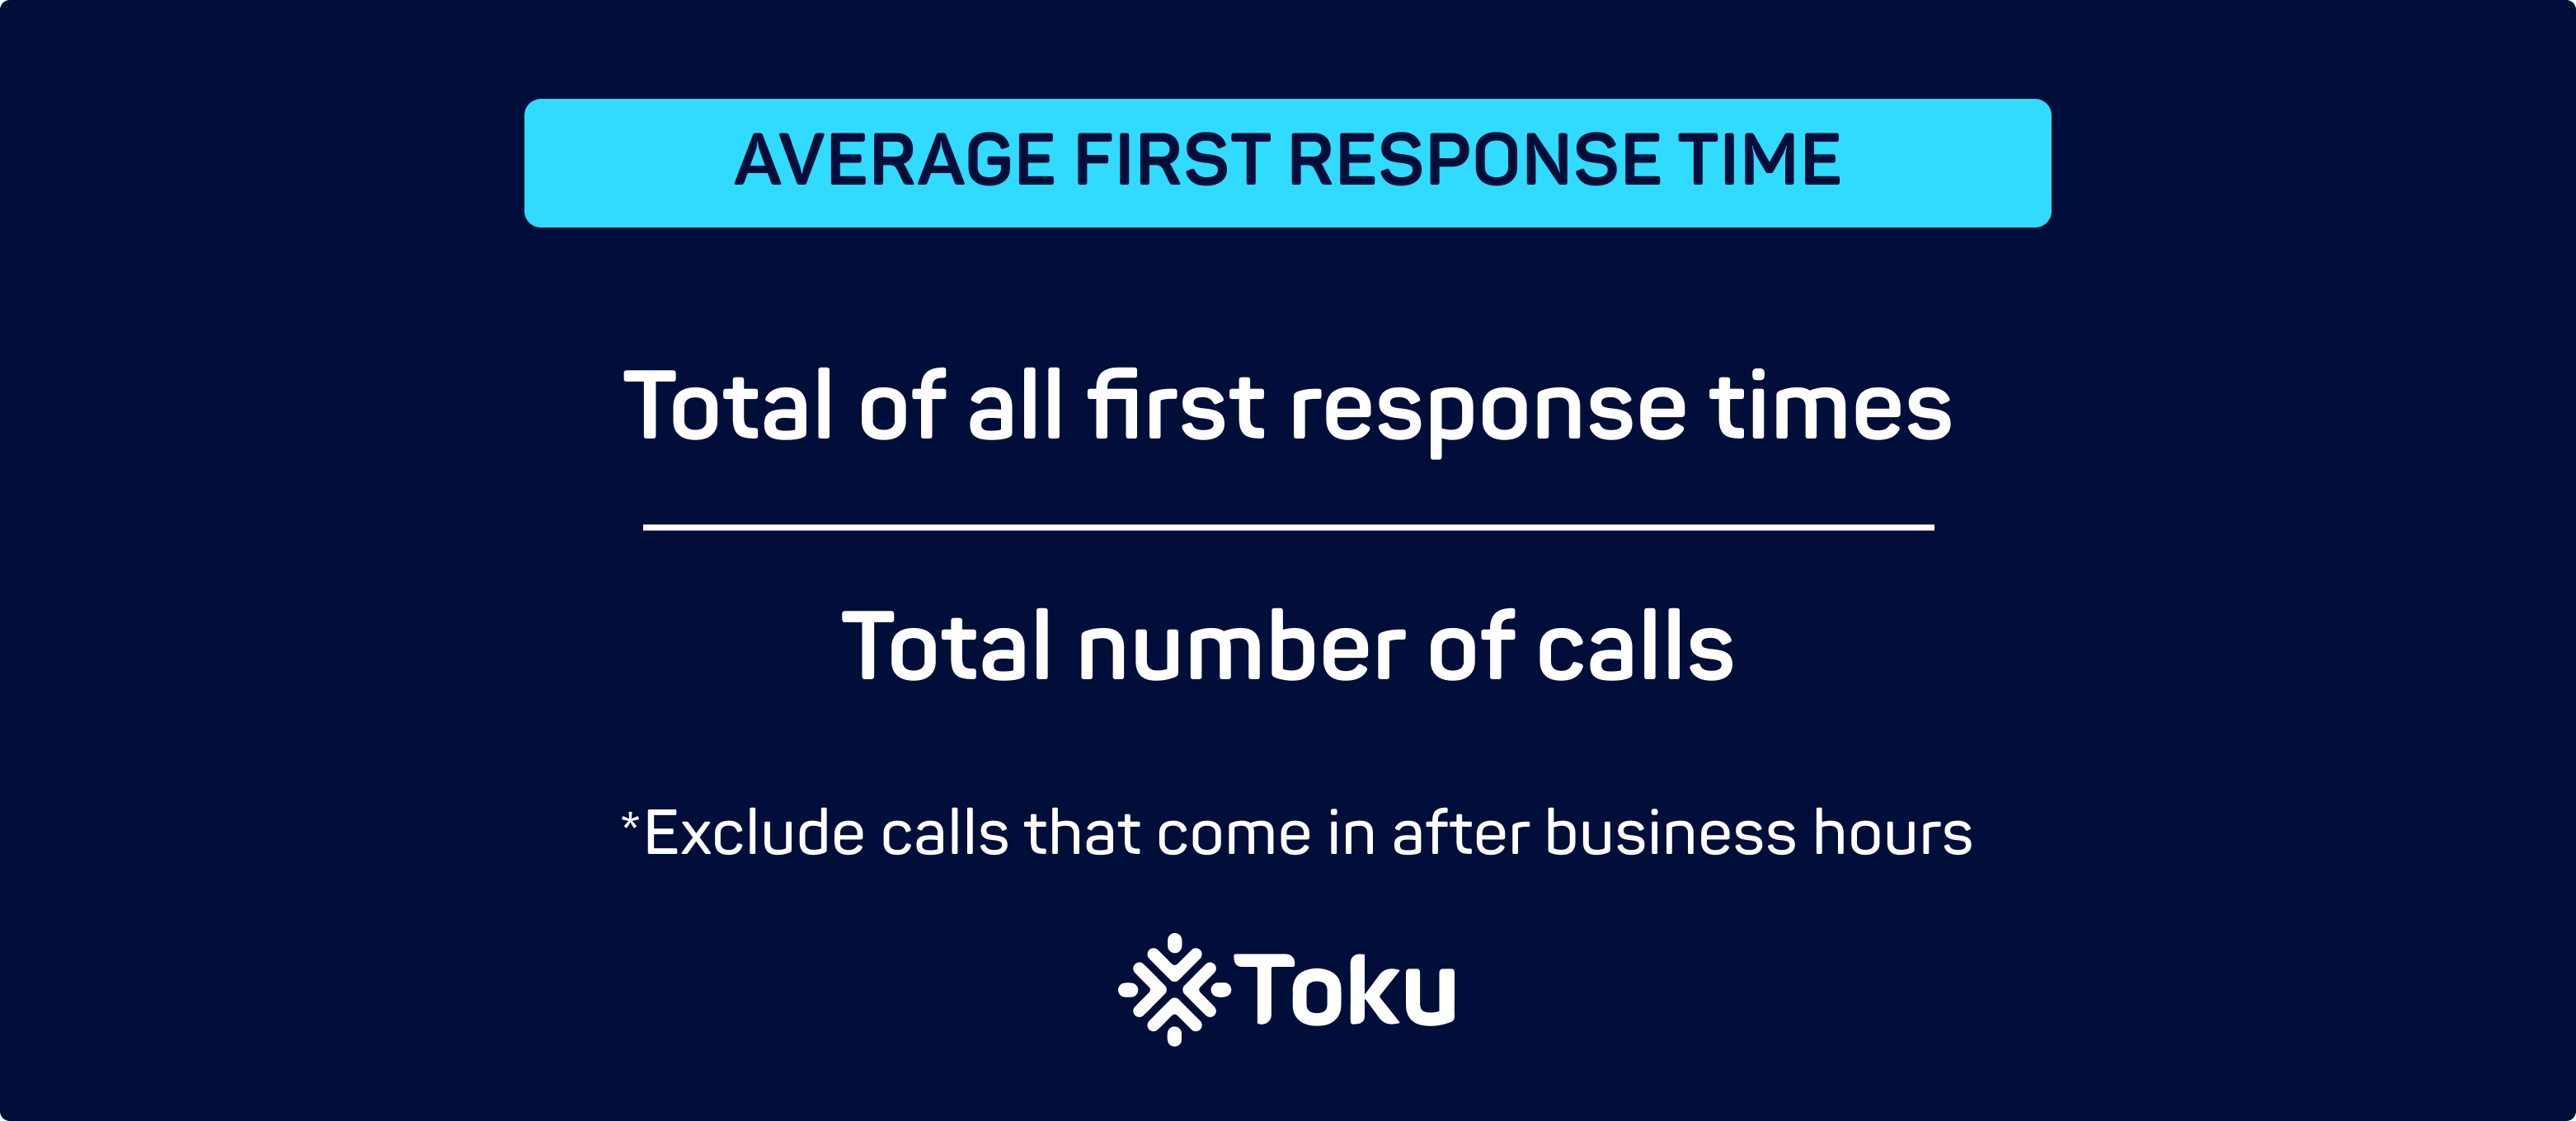
Here’s how to calculate First Response Time
- Add up all the first response times.
- Divide this by the total number of calls.
- Make sure to exclude calls that come in after business hours.
Why does first response time matter:
In the world of customer service, first impressions carry weight. A swift first response can set the tone for the entire customer interaction, leading to increased customer satisfaction and loyalty. On the flip side, a long first response time can create frustration, causing you to start on the back foot with the customer.
Operations Metrics
Ticket Volume
Understanding the volume of tickets your contact centre receives is crucial for resource allocation and service quality. This metric is usually calculated by aggregating the total number of customer queries, complaints, or other interactions that result in a ticket, on an hourly, daily, or monthly basis.
To get your ticket volume, simply tally up all the tickets generated within your chosen time frame. For instance, if you opt for a daily analysis, count the number of tickets created each day for a week, then divide by seven for an average.
Why does ticket volume matter:
Ticket volume is an essential diagnostic tool for managers to identify trends and predict future needs. High ticket volumes may indicate insufficient information available to customers or recurrent issues that need solving. Conversely, a drop in ticket volume could signal improved customer experiences or perhaps even gaps in your service offerings.
Monitoring ticket volume trends can enable you to identify patterns that suggest when you’re likely to experience a surge in tickets. This information enables you to make informed decisions about when to increase staffing levels, ensuring that your team is adequately prepared to handle higher workloads.
This metric can also be an early warning sign. For example, if there’s a sudden spike or drop in ticket volume, this could signal that something within your operations or offerings needs immediate attention. Timely intervention could mean the difference between a minor hiccup and a major operational failure.
Call Volume
Much like ticket volume, call volume represents another vital metric that helps to shape your overall customer experience strategy. It is the total number of inbound and outbound calls made or received by the contact centre over specific time periods—hourly, daily, or monthly.
Here’s how to calculate Call Volume:
- Sum up all the calls that go through your centre in your designated time frame.
- If you’re looking at an hourly rate, for instance, count how many calls are made and received during a single hour, then average this over your chosen time span.
Why does call volume matter:
Monitoring call volume is instrumental for optimising both human and technological resources. Elevated call volumes could imply peak service times, suggesting a need for additional staffing or automation to manage the load. A decrease in call volume might indicate that customers are finding the answers they need through other channels, in which case, the supervisor should consider investigating whether customers are shifting towards these other channels for resolution or information. Similar to ticket volume, analysing call volume trends can help forecast future needs and inform staffing decisions.
Don’t be a slave to the numbers: Make metrics matter
It’s crucial to remember one foundational principle when monitoring your contact centre metrics: metrics alone don’t make a successful call centre.
The secret sauce is training your team not just to track these numbers but to interpret and act on them effectively. Your staff should understand the ‘why’ behind each metric—why it’s crucial in the grand scheme of things and how it contributes to both operational efficiency and customer satisfaction.
Investing in intuitive contact centre software can be a game-changer here, streamlining the analytical process so that even in the heat of the moment, the right choices can be made swiftly. Do this, and you’re well on your way to a contact centre that transforms into the profit centre for your business.
Don’t stop at contact centre metrics
Discover how leveraging integrated analytics can elevate your contact centre into a high-performing profit centre for your enterprise.
 Thomas Laboulle
 Girish Dharmaraj
 Nora Huin